Historically, trigonometrical surveying was a way of mapping geographic locations that started with a single straight line. In 1801, a trigonometrical survey of India started with a single seven-and-a-half-mile straight line at the bottom of the country. The intent was to draw one triangle at a time, until the entire country had been mapped. Projected to only take five years, it ended up taking about sixty-nine years to complete.
Led by the British, it must be said that the purpose of the survey was to address the value of India as an export nation. Though the colonial history cannot be ignored, the British developed a system so robust that it could be used for decades with a consistent result, and this is what intrigued me. Looking at how they developed their system, I was inspired to create my own system that would be just as strong. Through this system, I was looking to find things that were going unnoticed. By creating my own trigonometrical survey net, I was able to locate and explore these hidden things within an ecosystem.
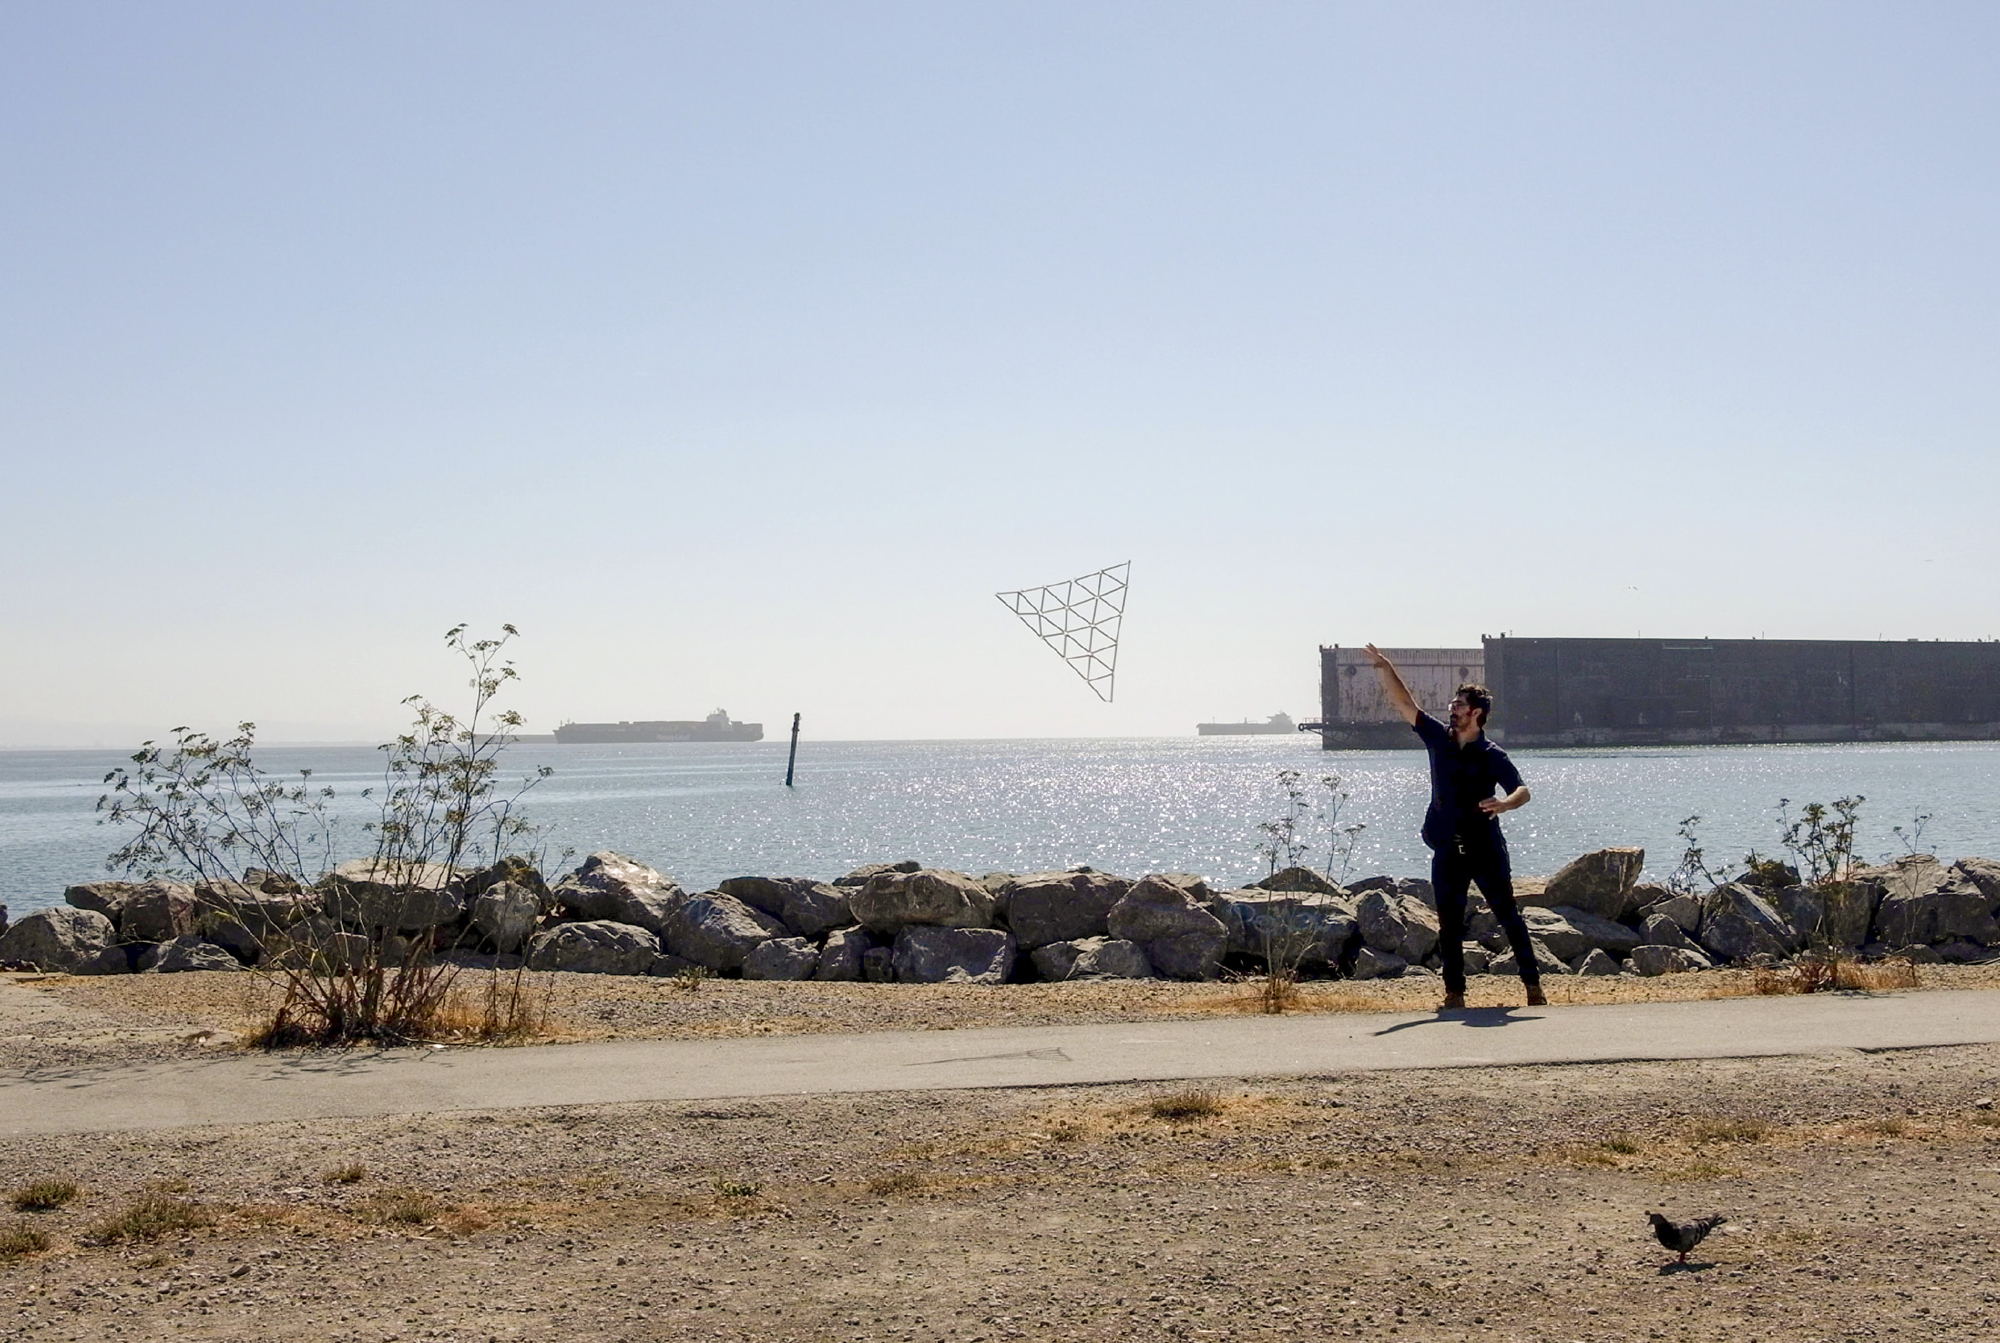
In an effort to randomize my findings, I looked to the process of quadrant analysis as a method of activation. This accepted scientific method is designed to map species in a particular area, and is activated by throwing a grid into that area. This method is a way to maintain an impartial sample set.
The inspiration behind the tool that accompanies my survey net is the work of sound artist, Alvin Lucier. Lucier’s work often employs custom build apparatuses that respond to the subtlest of environmental effects. I wanted to create a tool that, in tandem with my net, would highlight subtly like Lucier’s work.
The creation of the net was intended to serve as a tool to gather data with no discernible purpose but to activate the imagination of the viewer. Looking at the research findings as a collection of evidence, the viewer should get a sense that there is something larger at play.
After the net has been thrown, the next step of the survey is the application of the viewfinder, an important tool that works in tandem with the net. The intent is for the aperture to isolate and heighten areas. When all appropriate forms of documentation are collected, the user can move to the next data set, or triangle and begin the process over again.